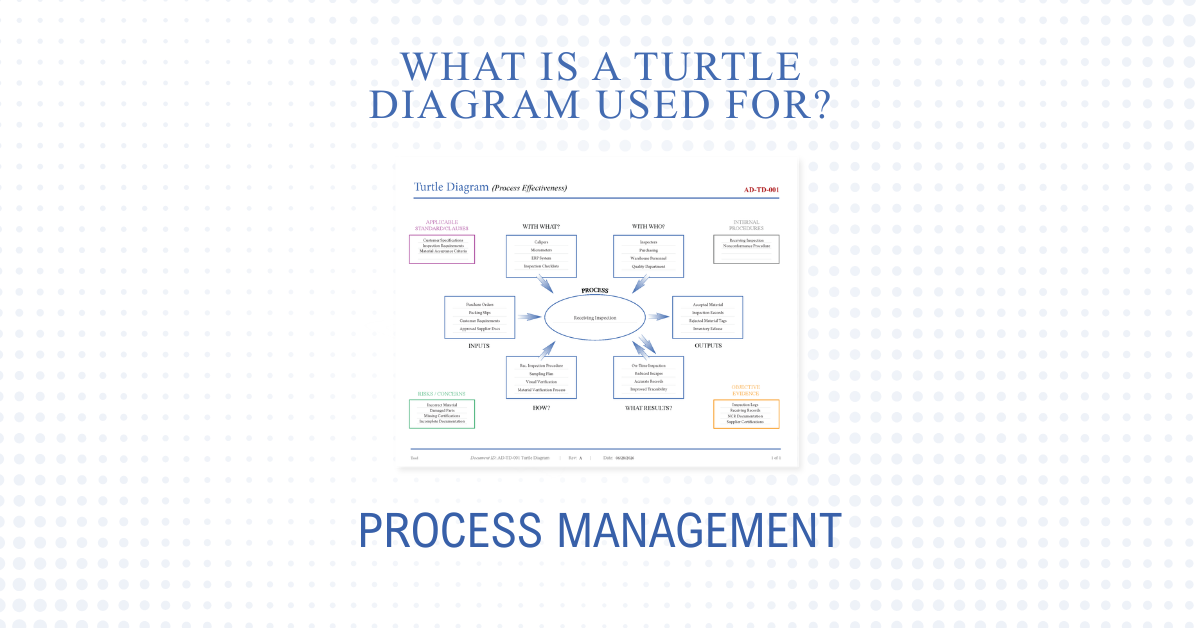
A turtle diagram is used to visually define and evaluate a process within a quality management system. It helps organizations identify process inputs, outputs, resources, responsibilities, controls, methods, and performance measurements in a structured format.
In AS9100 and ISO 9001 environments, turtle diagrams are commonly used during:
- Internal audits
- Process reviews
- Employee training
- Risk-based thinking activities
- Management review preparation
- Certification audits
Rather than describing a process only through procedures, a turtle diagram presents the process visually so interactions and controls are easier to understand.
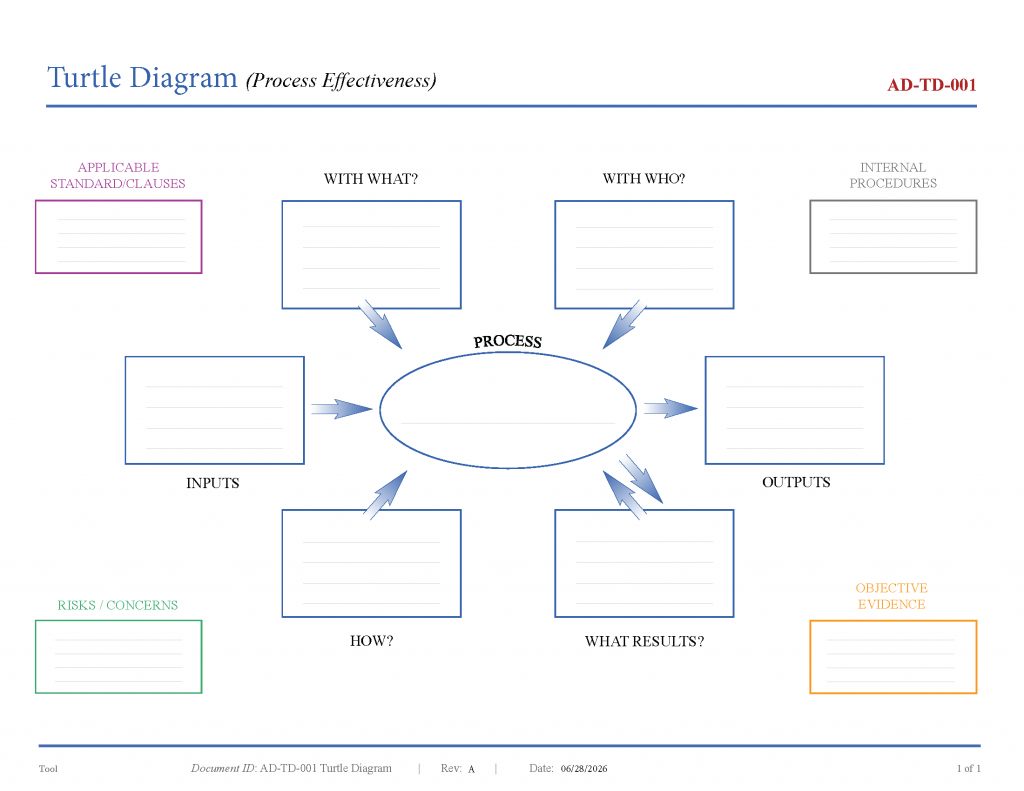
A typical turtle diagram includes:
- Inputs
- Outputs
- With What? (equipment/resources)
- With Whom? (personnel/competence)
- How? (methods/procedures)
- Metrics or results
- Risks and controls
For aerospace and manufacturing organizations, turtle diagrams help demonstrate process effectiveness and support process-based auditing approaches required by AS9100.
Well-structured turtle diagrams can also improve:
- Process consistency
- Communication between departments
- Auditor understanding
- Training efficiency
- Identification of process gaps
A turtle diagram helps organizations better understand how a process functions by visually organizing inputs, outputs, responsibilities, resources, controls, and performance measurements. When properly developed, turtle diagrams improve process visibility, support auditing activities, strengthen operational consistency, and help teams identify opportunities for continual improvement.