
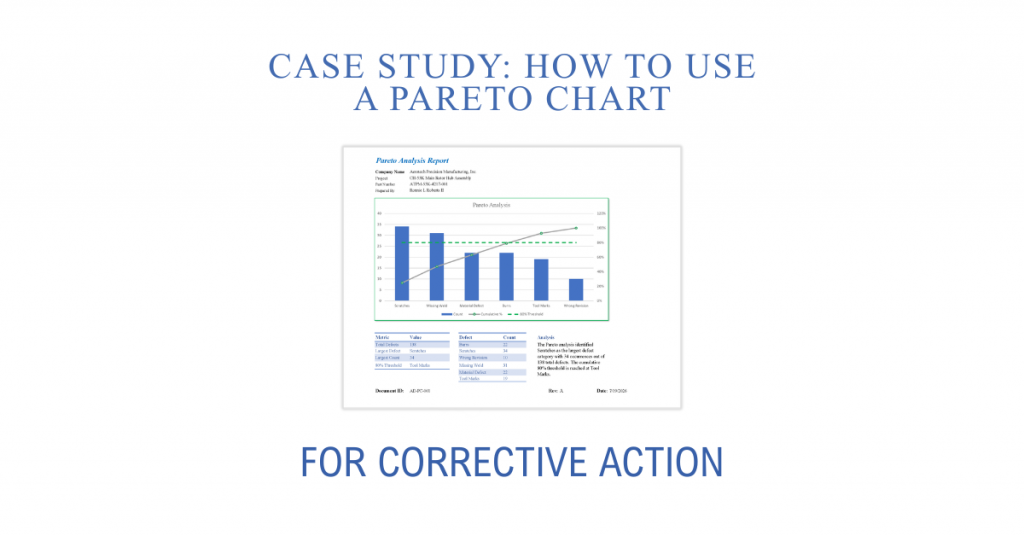
Case Study: How to Use a Pareto Chart for Corrective Action

Case Study: How to Use a Pareto Chart for Corrective Action

Corrective Actions Should Begin with Data, Not Assumptions When quality issues occur repeatedly, the immediate response is often to investigate the most recent failure. While this may resolve an isolated event, it does not always address the defects having the greatest impact on quality, cost, or customer satisfaction. A Pareto chart provides a structured method […]
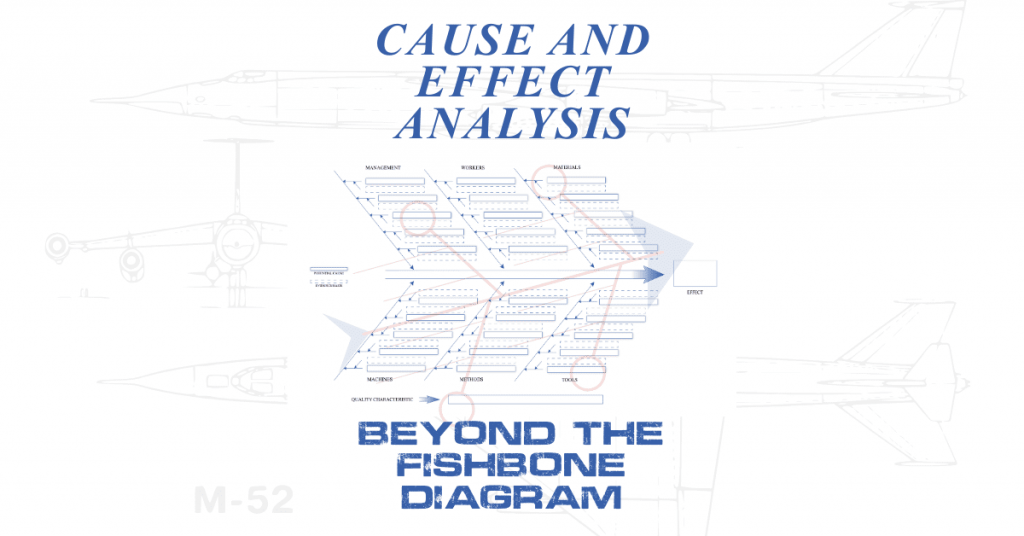
Cause and Effect Analysis: Beyond the Fishbone Diagram

Cause and Effect Analysis: Beyond the Fishbone Diagram

Cause and effect analysis is one of the most widely recognized methods used in quality management to understand why problems occur. Commonly associated with the Ishikawa or fishbone diagram, the method provides a structured way to examine how multiple factors may contribute to an undesired outcome. Despite its familiarity, the method is often applied superficially. […]